Is your organization changing its staffing plan? Is there a voice that taking more graduates on board will be more economical? Does it look like seniors (those costly and hardly manageable) are replaced by juniors (freshly thinking and self motivated)? This topic is coming up every noun again, and we tried to examine it in dollar figures.
 Assume a virtual engineering company which has 5 seniors and 5 juniors. This team currently does 100% of the monthly work and makes a gross monthly revenue of $150K average. The salary fund is 1/3 of this number and the seniors are paid twice more than juniors, thus we have the equation 5*2*x + 5*x = $50K, where from a junior gross salary is $3.300, and a senior is getting $6.600 gross. Sounds about right?
Using the Pareto principle, we can sensibly assume that the seniors produce 80% of value adding results, e.g. those results the company is paid for by clients. The juniors, thus, produce the remaining 20%. Let’s now assume all seniors are equally productive among their group, and all juniors – among their group. As such, each senior has a 80% / 5 = 16% and each junior has a 20% / 5 = 4% share in the total 100% of the monthly work done in the original configuration of the company (Chart 1).
Assume a virtual engineering company which has 5 seniors and 5 juniors. This team currently does 100% of the monthly work and makes a gross monthly revenue of $150K average. The salary fund is 1/3 of this number and the seniors are paid twice more than juniors, thus we have the equation 5*2*x + 5*x = $50K, where from a junior gross salary is $3.300, and a senior is getting $6.600 gross. Sounds about right?
Using the Pareto principle, we can sensibly assume that the seniors produce 80% of value adding results, e.g. those results the company is paid for by clients. The juniors, thus, produce the remaining 20%. Let’s now assume all seniors are equally productive among their group, and all juniors – among their group. As such, each senior has a 80% / 5 = 16% and each junior has a 20% / 5 = 4% share in the total 100% of the monthly work done in the original configuration of the company (Chart 1).
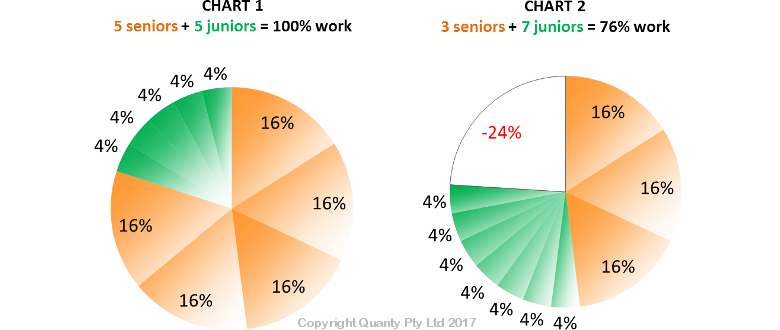 Now, the time for change came: Two seniors were dismissed or have resigned or got retired. They were replaced by two juniors. The salary fund is now 3*2*x + 7*x = $43.330 and we have $6.600 savings. What happened to the organization load capacity though? It is now: 3*16% + 7*4% = 76% (Chart 2). This likely means that the next month will only invoice 76% * $150K = $114K. The total is:
- Savings +$6.6K
- Losses – $36K
- Net: $29.5K loss
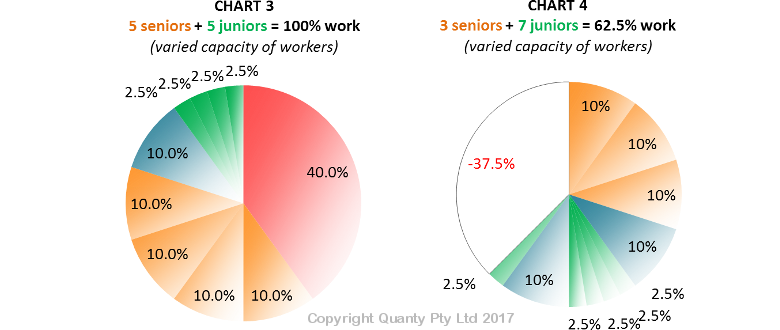 Suppose two seniors have resigned. As a matter of chance (we will quantify it just below), one of the dismissed was that very senior who did the most work (40% capacity in red in Chart 3). The nature compensated such a misfortune by sending over one more very talented junior (10% capacity in blue in Chart 4) amongst the two new juniors just hired. What is the company’s work capacity now? 3*10% + 2*10% +5*2.5% = 62.5% of the original one, hence the next month will invoice only: 62.5% * $150K = $94K. The balance is:
- Savings +$6.6K
- Losses – $56K
- Net: $50K loss, e.g. the whole value of the salary fund.
 We might now debate that juniors and seniors have different tasks. That juniors can do basic jobs better than seniors (is that right?). But, in application to engineering, seniors perform most value adding work, and probably, at the 80% / 20% ratio, would you agree?
The message from this arithmetic analysis is that the policy of retaining knowledge and talent must be adhered to, equally in the modern context of money driven decisions.
Thinking about this problem more holistically, every organization has three phases of growth:
We might now debate that juniors and seniors have different tasks. That juniors can do basic jobs better than seniors (is that right?). But, in application to engineering, seniors perform most value adding work, and probably, at the 80% / 20% ratio, would you agree?
The message from this arithmetic analysis is that the policy of retaining knowledge and talent must be adhered to, equally in the modern context of money driven decisions.
Thinking about this problem more holistically, every organization has three phases of growth:
- Initial development and progress – this is where enthusiasts are needed much
- Stable phase at the peak of performance – a contest of progressive and regressive elements
- Ageing phase, where bureaucracy starts prevailing over the system quality, best people are sacked.