Equipment risk analysis is a core activity in plant risk management. Many spears were broken about prioritizing individual equipment monitoring and risk controls, to ensure its safe and reliable operation. We have arrived to the capability of performing risk assessments at 5 levels of depth. This multi-level approach enables a two-fold cost/benefit optimization: analysis cost is minimized and a risk cost analysis is enabled where required. This article shows applications to pressure equipment inspection planning (RBI).

Drivers for multi-level RBI
We naturally recognize two levels of approach to engineering problems:
- First-pass system screening for criticality
- In-depth analysis of critical elements only
This sequence of tasks well optimizes time and efforts. The only precaution is not to get locked into the screening step (1) solely. Critical objects require a detailed analysis (2) as well, if we want to be confident about the plant integrity and minimize unexpected business impacts due to equipment failures.
Sounds good enough? Then, why are 5 levels any better than just two?
Because typical oil and gas plants have hundreds and more pressure equipment tags and piping damage circuits. An RBI assessment of a large plant can easily take years. The assessment outcomes optimization motive triggers the risk assessment flexibility requirement. That is the owner’s opportunity to change the level of detail according to the anticipated risks. And the more levels are available, the more effective optimization is achieved at all consequent detail levels. The optimization not only concerns the budgets spent, but mostly – the confidence and adequacy of the analsyis.
Therefore, the owner/operator should take a serious care about developing the RBI, or other risk analysis strategy, prior to proceeding with it. It is good to see multiple options beforehand. Let’s look at some practical examples:
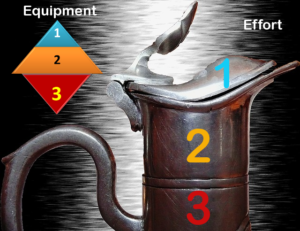
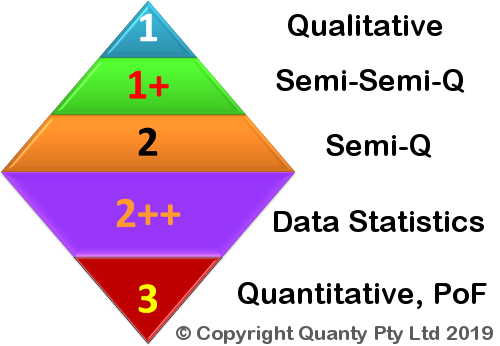
Levels 1 and 2: Qualitative and Semi-Q RBI

The volume of work done and budget spent at these two levels can be visualized as the volumes of the lid and the jar shown in the picture. The number of equipment units falling within each category is somewhat similar to the area of the pyramid levels. Most equipment typically requires more than just a ‘Level 1’ effort.
- Level 1 is a qualitative screening, for example using a 2×2 risk matrix. The risk components are: failure likely/unlikely and has consequence/ no consequence, often evaluated using expert judgments. Qualitative risk levels (Low/Medium/High) are assigned as a result. Usually, client side integrity engineers perform such a quick screening nearly automatically. This is done to identify non-critical equipment to be excluded from further RBI activities. This is a common sense step.
- Level 2 is the bulk detailed assessment work, where a rather relative quantification of the likelihood (LoF) and consequence (CoF) is performed. It usually involves some 5×5 or similar risk matrix together with basic ‘remnant life’ numeric estimates and some conservative numbers for consequences (costs and victims). This level is called Semi-Quantitative (Semi-Q), although it could be called semi-qualitative as well. Let’s elaborate a clear definition for the Semi-Q RBI:
A Semi-Q RBI methodology applies a deterministic analysis of integrity data, to predict a limit state occurrence (a specific time instance to achieve a critical damage extent):
RemnantLife * IntervalFactor = Inspection Interval
Consistency and robustness are the Level 2 benefits, but these are limited by the relative risk and budget prioritizing outcomes. This is because remnant life figures don’t address the probabilistic nature of failure events. In this way, the risks become prioritized, but the budgets are not yet optimized.
Nevertheless, Level 1 screening preceding the Level 2 Semi-Q assessment is a smart RBI practice and a good value. A sole Level 2 RBI is less optimal budget-wise, but is more compliant.
Adding the Level 3 – Quantitative assessment
How about capturing that probabilistic nature of potential failures? This is estimating the Probability of Failure (PoF) versus time for predicting how the risk cost and safety implications will grow over time. And therefore, to perform a numeric cost/benefit analysis of each risk barrier or design option.
Indeed, adding the Level 3 to the pyramid should be selective and only applied to high risk equipment. Because achieving the added confidence (of the cost/benefit analysis) will have its own labor cost too. A rough proportion of each RBI level budget-wise is shown in the picture. Level 3 produces absolute risks in physical units (dollars and safety exposure versus time). Thus, a cost/benefit analysis of risk barriers can be readily made.
This is why we called our company QUANTY – we understood the need for, and eventually developed that practical Level 3 analysis CoRBI® to enable a quantitative cost/benefit analysis from actual integrity data (more details in this post). Our method is different to API-581. Our method uses equipment individual integrity data statistically, as opposed to generic failure statistics by equipment type.
A quantitative RBI methodology should predict individual equipment PoF versus time in terms of $ cost and safety exposure, to enable a transparent numeric safety demonstration and risk control options analysis.
To summarize, the quantitative Level 3 should be applied to the most ‘risky’ equipment identified at the Level 2, in order to predict the risk implications versus time, hence, to make a confident, PoF-based optimization of risk controls.
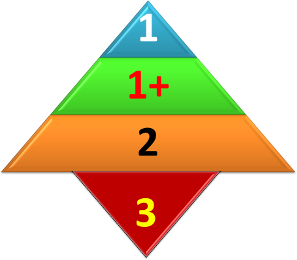
Adding Level 1+ ‘Semi-Semi-Q’
Did you ever need to identify how useful can be an RBI application to particular plant? Which equipment units can be safely addressed by a ‘half-life’ inspection regime, without a ‘full blown’ risk assessment application? The Level 1+ answers exactly these questions, by applying a simplified hazard analysis.
To explain the regulatory background, Australian and American RBI standards offer generic provisions for half-life inspections. This makes sense for equipment with long ‘remnant lives’ and is very simple:
InspectionInterval = ½ * RemnantLife
A major issue with applying such a strategy is that if anything goes wrong – there is a disclaimer clause in that standard, which can be read two ways like: yes, this is permitted, subject to your liability for the outcomes.
Therefore, we need to make sure that these items are in fact low consequence. If so, we can exclude these ‘half-life’ items from the Semi-Q Level 2, thereby save the budget for more interesting activities (like Level 3 assessment, long holidays or whatever useful we can do). A simple hazard analysis can be sufficient for such a decision and is quite compliant as well.
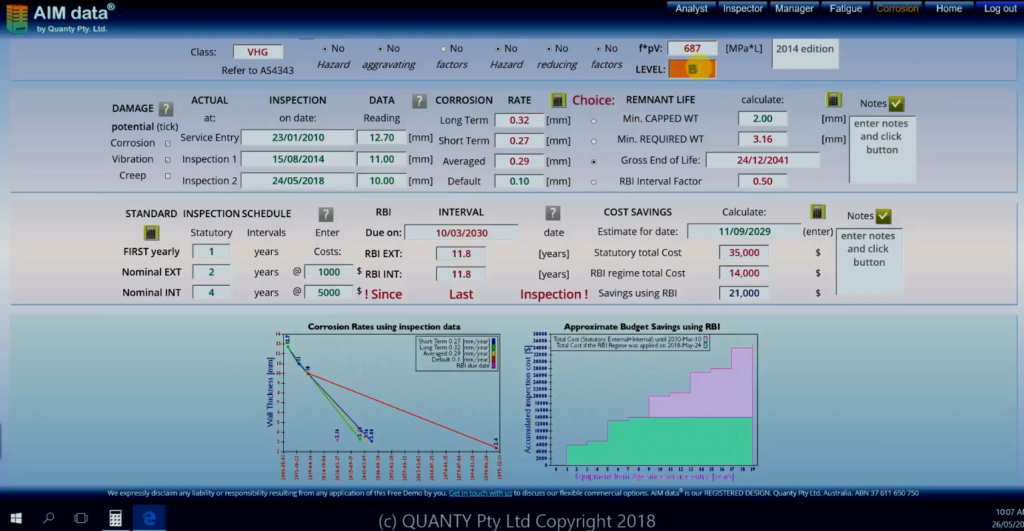
We said – we’ve made: the below is a screenshot of our online toolbox, which enables the Level 1+ as a matter of minute effort:
Summarizing: applying the Level 1+ reduces the Level 2 scope. It also provides the Level 2 input data for those items which don’t qualify for half-life inspections. Note how the risk assessment flexibility and adequacy can be improved by introducing this simple step.
Adding Level 2++ ‘Statistical Data Treatment’
We have created the Level 2++ as a matter of by-product from our CoRBI® (Level 3) development. It turned out that our tools for statistical analysis of inspection data may serve as a stand-alone assessment level for:
- Extrapolating corrosion data to non-inspected areas (that is upgrading the Level 2 safety)
- Identifying manufacture-born thickness variations and off-spec features (like two pipe wall schedules in a circuit vs. corrosion)
- Assessing inspection performance (human errors, thick coatings, otherwise anomalous readings and non-representative data sets)
- Recommending or not recommending an increase of inspection coverage and/or selection of advanced NDT tools where relevant.
This is just a brief snapshot to keep in-line with this article topic. One important benefit from the Level 2++ is the capability to refine the Level 2 confidence (where required) for a little added cost, as well as putting more sense into the NDT planning activities from the evidential data standpoint.
Putting things together

If you watched the title video with carousels, you may feel like riding them by now. See how many options are there, but they aren’t just a kaleidoscopic picture. Each risk analysis level has own best confidence application on the risk axis. For example, a corroded refinery column is a good client for the Level 3, while a potable water tank can be finalized at the Level 1.
Implementing these 5 levels consequently and systematically assists in optimizing risk assessment budgets and confidence to the highest extent. On the other hand, it’s all flexible: you are free to omit any Levels you don’t need in a current context. The multi-level risk analysis strategy is a powerful booster for a practical and measurable asset management upgrade. More importantly, we can now use the truly probabilistic (and the most realistic) quantitative Level 3 for an ultimate cost/benefit decision making.
Write us few lines here if you are interested to know more.
What industry are you in?
Are you wondering how to apply this strategy for it?
We will be happy to see your comments.