Failure Probability is relevant to individual equipment and is a function of time. Failure frequency is relevant to a population of units, and is averaged over a time span. Which level of consideration should we use? It depends on the context and our goals. Let’s drill this topic down from rocket science to engineering practice.
 There were 85 orbital launches in 2016 (refer this page). Two of them failed. The failure frequency was 2 / 85 ≈ 0.024. But does this tell us wether the pictured rocket will reach the orbit? No, it doesn’t. The failure frequency tells us what is the chance of reaching the orbit in any contemporary rocket. This is subject to the nowadays technical and managerial environment and applies if nothing changes over time. If any of the technical environment parameters vary, the failure chance will be altered. By how much exactly? The ‘simple’ solution is collecting evidential failure data and averaging it over time, as above. That is a generic failure frequency (GFF) of generic orbital rockets valid for the time span of 366 days of 2016. This frequency relates to a large population of units in a certain environment only.
For example, year 1976 had 5 orbital launches. One of them failed (refer Wikipedia) – that was a failure frequency of 0.2 meaning a ten times higher failure frequency than nowadays. We can see that a generic failure frequency is rather a gross and context sensitive statistical generalization of things.
Getting back to the practical question: ‘What is the mission failure chance of the pictured rocket (or pressure vessel, or clothes hanger or any individual object)?’ If we are interested in a particular individual item, we need to model it in particular, e.g. in the terms of its intrinsic Probability of Failure (PoF). PoF is a physical quantity of the failure chance That chance ever increases over time from a small value (‘as built’) to a 100% depending on the individual operation history. To get some feeling of the PoF consider this funnel: 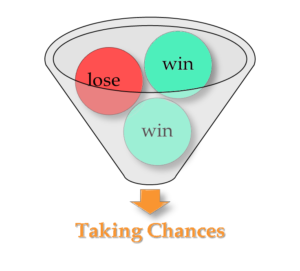
- Imagine, we are trying to extract out a single ball from this funnel without as much as looking at it at all
- Our chance to take the red ball will be 33% in 1st attempt, 50% in the 2nd and 100% in the last
- PoF increases along with the number of attempts, or with time if chances are taken continuously
- Say, the red ball is now one in a million chance. How do you feel about finding it in the 1st attempt? How about the 1001st?
- When we operate plant equipment, explicit attempts are not even necessary. Contrariwise, our risk control inaction becomes taking chances over time.
- In other words, the balls are dropping out from the bottom of the funnel at a certain rate, continuously. This is due to equipment ageing embodied in a form of corrosion, crack growth, or otherwise time dependent damage accumulation.
- Moreover, each piece of equipment has its own number of red balls in a funnel. It may even have a number of different funnels, which are various operational damage mechanisms.
Accordingly, operating actual equipment is like taking failure chances continuously. What matters is the ratio of the red balls to green ones, which ratio is the PoF, ever increasing over time. Knowledge of PoF versus time is like having a graph of our winning chance versus the number of various casino gambling attempts. Wouldn’t that be handy?  In terms of an industrial plant integrity management and budget control, the PoF knowledge yields a confident inspection and maintenance plan, which is optimal budget-wise. Why is the PoF(t) level largely missing in the practice then? Because the academic science mystified the PoF evaluation via heavy mathematical apparatus. The latter aims describing any event in the universe from a purely modeling basis. We are lucky to minimize the effort of building heavy models. This is because as we usually do have a sufficient evidential data from our plant operation instead.
For example, when inspecting oil and gas equipment, we obtain evidential integrity data of individual equipment items relevant to the current and actual operation environment. That data is inherently probabilistic and perfectly matches a PoF(t) assessment requirements. Such an assessment enables an ultimate integrity knowledge and budget control.
At Quanty, we pioneer the PoF(t) driven, and therefore – Cost of Risk substantiated integrity management. This is our confident and lifetime-wide response to the current financially tough times. Our CoRBI® strategy addresses any integrity environment changes automatically, since it is based on actual integrity data, as opposed to generic failure frequencies. A question: In your opinion, did your plant operation environment change since 1990s (when the GFF data was collected)? Consider the equipment manufacture quality and integrity management. To learn more about CoRBI® you can watch YouTube videos at our main page of simply flick us a message via the contact form. You may also continue reading in this post.