Here we start a new series of posts which explain what exactly we offer by our New integrity management methodology. Please don’t hesitate to communicate your thoughts or critics. Welcome aboard our rocket ship!

Issues with traditional RBI?
Risk Based Inspection planning (RBI) is on the scene for decades. Its rightful concept of proportioning integrity budgets to failure risks is a great common-sense solution for cost optimization.
The ever increasing budget savings pressure highlighted one major inability of the published RBI methodologies though. Financial management of industrial plants has set a question, which integrity management personnel can’t reply:
‘How much budget saving results from integrity management costs?’
What happens is that both parties – integrity responsible and finance responsible – are striving to adopt a correct decision. But sadly, they are unable to communicate in a common language. Because the current integrity management methods can’t enable a confident cost/benefit analysis for integrity spending options.
For example, you are facing a choice of which inspection tools to deploy on a pressure vessel and over what surface area. Failure of that vessel will shutdown the whole plant (and maybe few people. Costs of an advanced NDT inspection can be significantly higher than ‘in-house’ isolated UT spot checks. The options choice would often proceed as follows:
- Imagine, you have decided to inspect more thoroughly for an added safety. And then, you need the management approval. A cheapest option wins as only the inspection costs are available for a numeric comparison. Thereby, longer term financial results and safety implications remain unquantified. The management simply does its best, as an ‘added safety’ is being qualified but not quantified.
- The winning cheapest option, in turn, may formally state that the vessel can operate for another turnaround term. However, there is not much confidence as the damage area coverage was only sporadic, although inexpensive. More importantly, the data analysis was not even performed to a level where remnant lives can be quantified. This is because an added cost of advanced analysis was not quantified either. It’s a closed loop.
The actual issue is with the RBI methodologies themselves: there is no certain outcome of failure risks in dollars or potential injuries versus time. Namely, none of well known RBI methodologies can’t prove that they are plotting an actual PoF curve. This goal simply wasn’t set in these methodologies, as they pursued other goals (prioritizing budgets, but not yet optimizing).
CoRBI features (technical talk)
Now, a good explanation of what we developed (the CoRBI method) needs a comparison. Glancing at CoRBI, specialists think it is similar to API-581, as similar wording appears here and there. Obviously, our damage assessment and prediction model is substantially different to API. Please follow a corrosion example:
Plotting failure risks versus time can be attempted with the API-581, but their user factors will produce substantially different numbers depending on these factors choice (such as inspection effectiveness and so on). The following questions emerge:
Which of the API-581 possible remnant life/interval predictions is correct?
Or closer to the reality than others?
Or is there any prediction close to the reality?
From practical experience with such uncertainties, we have developed a new integrity assessment method CoRBI®, which stands for Cost-of-Risk Based Integrity management using Probability of Failure (PoF) terms.
Our PoF(t) is not the API POF=gff*{factors}.
Our PoF originates from the inspection data and has practically NO FACTORS. That means: ONE set of input data (say, corrosion measurements) produces ONE result, regardless of what we wanted to see. Also, it indicates where the inspection data is not statistically representative, thereby offering NDT inspection tools and coverage recommendations ‘on-the-go’.
A comparison study
Next figure shows the Probability of Failure (PoF) predictions we have obtained from example input data, in order to compare CoRBI and API-581 methods. This example uses actual internal corrosion data from multiple spot-check locations on pressure piping, which was statistically treated in CoRBI prior to the analysis. We also followed the API-581 route iteratively to construct their POF curves, according to our best understanding of them:
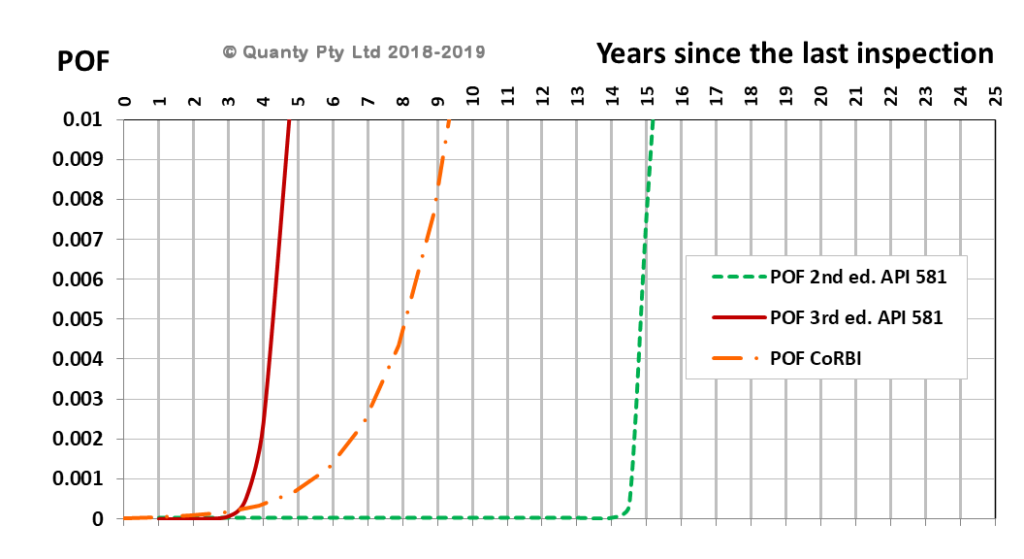
It is visible that the remnant life predictions changed drastically from API-581 2nd to 3rd edition (edition change occurred late 2016). CoRBI results are between the two API-581 calculations. Please also recall, that there can be many more curves originating from API-581 by varying its user choice factors. In contrast, CoRBI produced only one curve relevant to multiple data points ‘as measured’.
We believe that the CoRBI PoF curve shape is better consistent with the damage physics, as the transition from negligible to significant failure probabilities occurs gradually over years (orange curve). Contrariwise, API-581 derived curves indicate a sharp POF rise, which occurs within months at a certain age (say, green curve at 14 to 15 years). This anomaly is partly due to mentioned factoring of input data. But crucially, due to reducing the number of data points to a single ‘worst case’, hence to a deterministic remnant life.
This is not to criticize the API method, but to offer a constructive development over it. Indeed, a 20 years passed since the first API-581 was published first. The recent change of editions (and numbers) impacted the results’ confidence as well, would you agree?
The CoRBI PoF curve position is also consistent with the two API-581 options, nearly in the middle of them. To our knowledge, the CoRBI output is better consistent with integrity engineers experience-based perception of what practical corrosion inspection intervals should be. Considering that we never ever made any effort to position our (orange) curve anywhere (e.g. no factors), it suggests that we hit the target better (e.g. the safe inspection interval at PoF=0.001 in this example). We studied few numeric cases of pressure vessels and piping corrosion data. CoRBI produced sensible PoF plots in all of them.
CoRBI benefits (managerial talk)
Our method is capable to treat any numeric data on integrity condition (for example crack length, valve time-to-failure, and more). This is why we see it as a NEW RBI AND MORE. This is a complete novel Integrity Management Methodology which rests on engineering science and on the actual integrity data.
As a result, CoRBI does quantify integrity risks and predicts them in terms of fatality and dollar risk simultaneously. It replies the above cost/benefit question, promotes informed decisions, and harmonizes the financial and integrity teams interaction.
We took the challenge, and now it is up to the plant owners-operators whether we open these new frontiers together. We are ready for more work, even from other industries, and try all capabilities of this methodology.
Our digital portal can serve for the data exchange, even as demo for you initially. More about it is in this post.
To learn more about CoRBI® you can watch YouTube videos at our main page of simply flick us a message via the contact form.