Here we identify 10 typical and ever-returning problems of traditional RBI methods and eliminate them forever via our new RBI methodology.
Get ready for novel ideas beyond the traditional thinking and get ready to discover a holistically new upgraded World of Asset Integrity for the future.
Problems: NDT tools and coverage
- Firstly, cheaper corrosion inspection tools (manual UT) remain overwhelmingly popular. In return, they produce a false scatter of thickness readings. This scatter often triggers follow-up inspections, can also drive incorrect decisions.
- More importantly, the choice of UT spots and the extent of inspection coverage is a ‘boomerang’ problem in every RBI round. One solution is expanding the inspection coverage. Though, it isn’t a panacea due to high costs. A human factor in RBI planning also contributes:
- Less importantly, but changing testing locations (TMLs) occurs nearly always when another specialist reviews the inspection programs – a sign of subjectivity. Selecting adequate locations for UT is an art which can be learned. Nevertheless, on-going swapping of TMLs drives additional costs and further compromises the RBI certainty.
To summarize, the pulse-echo UT gauging (born in 1940s) is a comfortable and a ‘long proven’ tool. However its major application issue is choosing UT spots from a rather flexible discretion. Surely, RBI driven inspection plans add certain consistency to it. But in conjunction with the small footprint of the UT probe, a potential for missing defects is still high.
Consider this example:
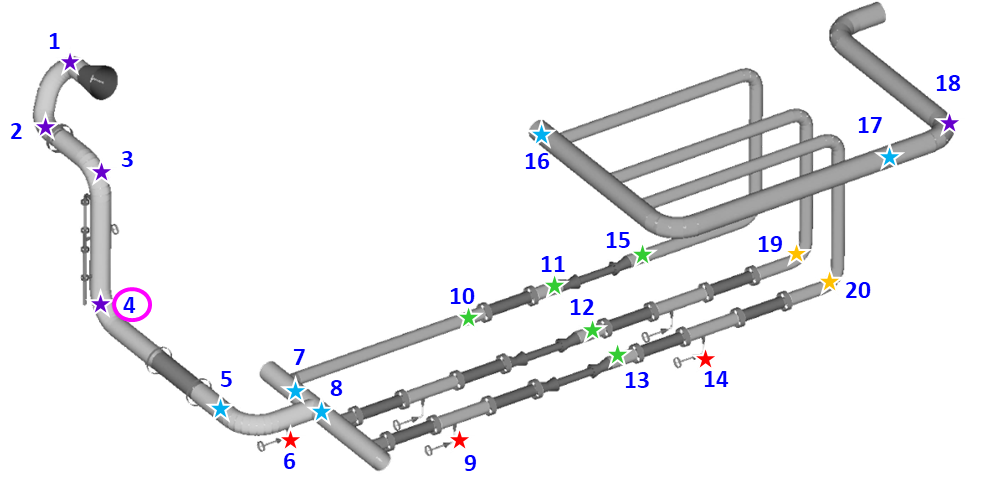
Here are 20 TMLs with four o-clock points each, 80 data points in total. How is this data treated, typically? A single ‘worst’ location is selected for a conservative estimate of the ‘Remnant Life’ (RL). All good?
All bad. Firstly, the net labor efficiency is 1/80=1.25%. Secondly, there is no guarantee whatsoever that the ‘worst’ location is actually the worst. Since most of the piping surface remained untested due to inspection costs.
Thus, instead of inspecting more locations immediately, we suggest first analyzing all the available data points statistically. And only then escalate the inspection coverage, if required from the analysis outcomes:
Solution A: Statistical analysis of data
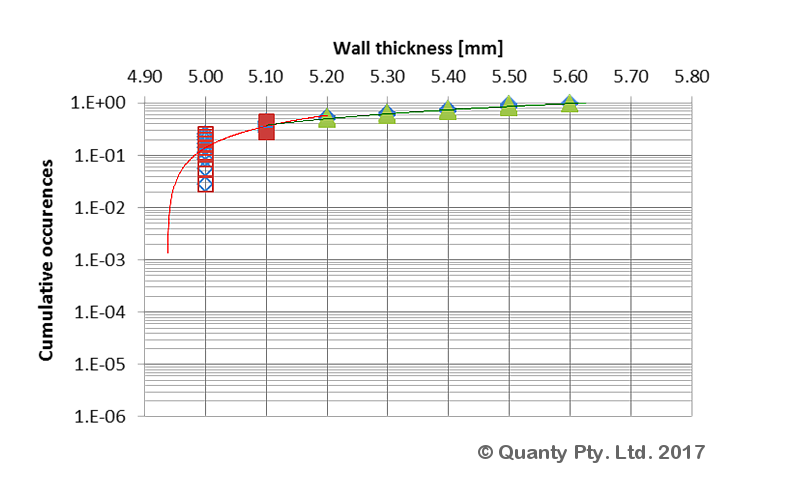
We developed a custom statistical plotting technique. It is different from Extreme Value Analysis (EVA). We don’t extrapolate to a single extreme value. We use the whole probabilistic distribution of thicknesses instead.
In this way, wall loss probability laws (figure below) and corrosion instances (red) usually show up themselves. Poor coverage, anomalies and normal variations (green) are all straight visible from such a plot:
This statistical plotting is an effective solution for many challenges of inspection planning:
- Treating UT data taken ‘somewhere’ and ‘somehow’
- Judging on what coverage is adequate
- Distinguishing manufacture born thickness variation and anomalies
- Recommending advanced NDT tools where necessary
This analysis can be done using spot UT data of piping or grid scans of vessels. Surface mapping NDT techniques are certainly very welcome too.
Basically, we can use the statistical plotting as a stand-alone analysis. But even more value can be gained from supplementing it with a fully probabilistic failure assessment, to combat the next group of issues:
Problems: ‘remnant lives’ and user factors
- To demystify the major Semi-Q RBI belief: a single figure REMNANT LIFE DOESN’T EXIST. If an RL prediction gave a figure of 4.6 years, what is a chance of the failure occurring exactly in 4.6 years? The chance is simply minuscule. There is not a RL, but a Probability of Failure (PoF) function developing in time. Integrity failures are random and probabilistic events.
- Probabilistic analysis doesn’t tolerate any user choice factors. Even a single factor can distort the PoF by orders of magnitude. This fact is well known in material fatigue analysis and applies to all other damage phenomena as well. If a remnant life assessment contains a factor, it will rarely produce a true PoF for an individual equipment of concern.
- A single reading (that ‘worst case’) is UNABLE to provide probabilistic inputs. Obviously, one input data point will only produce one result point (which is the RL). In contrast, estimating PoF requires a statistical distribution of corrosion data.
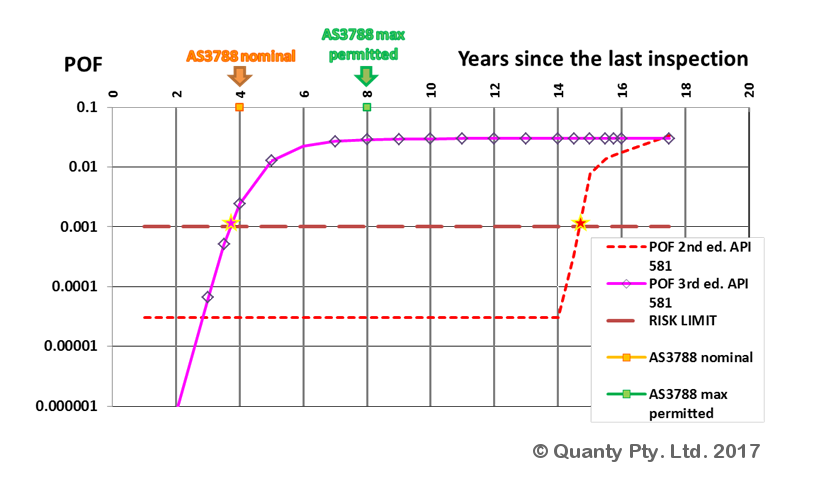
By the way, the API-581 ‘magic’ of applying factors over ‘generic’ failure frequencies is a form of Semi-Q RBI. Because it uses the RL-type equation (‘Art’) and user factors for failure likelihood estimates. - Finally, to illustrate the API-581 substitute of terms ‘risk cost‘ and ‘POF‘, we’ve done a case study using the 2nd and 3rd editions of API-581 (below). Look at the risk limit crossings: If the change of results among the two editions was so large, then what is the chance of getting true results now and then? Is the ‘POF’ correct? Is the ‘risk cost’ correct?
Therefore, we decided to develop an alternative life assessment methodology.
Solution B: Fully probabilistic life assessment
Following the above findings, one may think about avoiding RBI at all. That would be a wrong option, as any risk assessment driven integrity decisions are indeed very practical, including a Semi-Q RBI. But if you are after numeric costs and safety levels, it needs an upgrade to evidential PoF(t) terms. There are no other shortcuts.
Our CoRBI® methodology re-solves all the above problems. In the below figure, a corrosion circuit PoF(t) (aqua) originates from the above statistical analysis and material strength-load data, It is then screened versus a risk limit (brown) to provide the risk exposure cut-off (safety comes first):
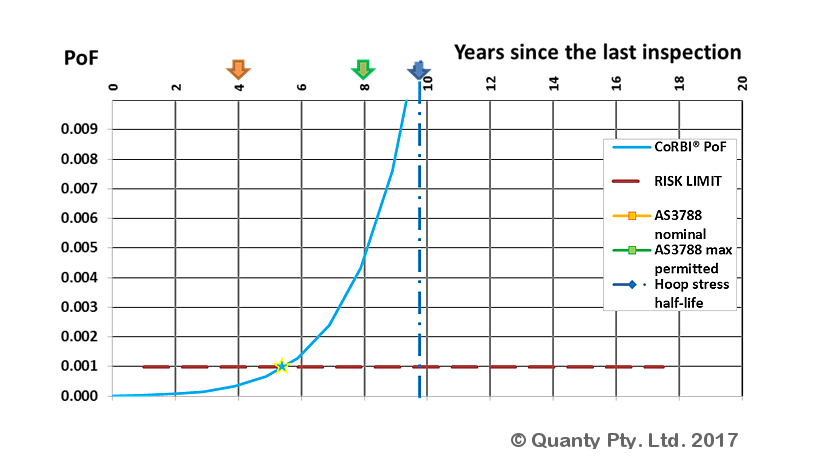
The assessment inputs/outputs aren’t manipulable here (Do you remember: no factors?). In addition to a more confident future damage projection, we automatically received two splendid bonuses:
Knowledge of the PoF(t) enables a seamless transition to the numeric cost of risk and safety exposure levels:
Problems: Relative risks impair budget and safety decisions
- Uncertain safety exposure levels in a plant. Say, our business goal (or safety case) claims an annual fatality exposure of 0.001 worker/year. But how do we prove that for such and such plant area? We can’t.
Unless we draw the safety limit (dashed line) and intersect it with the PoF curve (in the above figure). Compliance made automatically! - Tension in budget allocation. This problem is gate-keeped financially. Because integrity teams can’t produce risk cost figures from factored RL assessments. Thus, further spending on integrity is financially unjustifiable from a traditional RBI planning.
In reply, we can screen all improvement options using the PoF(t), to compare failure risk costs versus costs of risk controls:
Solution C: Cost/Benefit analysis from PoF
Namely, the PoF(t) maps directly into dollar figures. The only additional input is a realistic estimate of the failure consequence. The consequence can originate from a former traditional RBI (refer the pot legend):
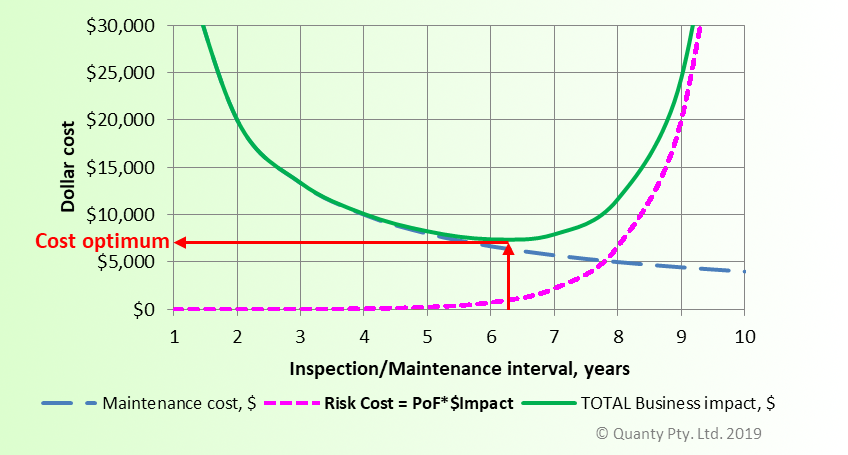
The above cost/benefit optimization enables a straight financial argument for risk controls: Tools, methods, barriers and even design options can potentially be compared on a dollar scale. This feature is as much holistic as it can only be. It is also really helpful for critical equipment, where a shutdown timing can be of a paramount expense.
Less critical items can be left for traditional RBI methods. On the other hand, probabilistic analysis of lower risk equipment has a great deferral potential too. And that decision will be justified and compliant simultaneously.
To explain, we always apply several levels of RBI complexity in a project: Start from a basic screening, then gradually escalate the assessment depth for higher risk equipment. This approach optimizes both integrity and assessment budgets. Sadly, such a useful opportunity is often missed by commercial RBI software because:
Problem: Software driven RBI

- It is spectacular how an expensive RBI software can resemble ‘a cart in front of a horse’. The software ownership implies that it must be used. In turn, this implies the usage of a built-in methodology (mostly API-581). So the software reduces the potential flexibility and adequacy of the RBI planning. Using a single RBI level for a whole plant is seldom optimal. This dilemma encourages integrity engineers to overwrite the machine RBI results day by day. What do we do then? Ask to re-program the commercial software?
Solution D: IDMS software for routine automation
Thus, we created our own software AIMdata®. It is an original and paperless Integrity Data Management System (IDMS) accessible online. Its most different feature is supporting any kinds of RBI methods. You can read more on it in this post.
How did we achieve that? In our view, computers should automate only basic and straight forward tasks. Human professionals are here for making the responsible and sensitive decisions. As such, some 80% of the data handling tasks is done by our IDMS, while the rest 20% are left for engineers’ thinking.
Perspective: Way further
We have completed the list of practical RBI upgrades.
The system of solutions A, B, C, D truly opens new frontiers for a plant integrity management efficiency, confidence and sustainability.
Simply tick your current problems
Now it’s up to you whether the rendezvous will continue,
or you would rather eliminate them all at once.
We do recognize: it’s a matter of human psychology to open the mind, step out of the pseudo-comfort zone and start moving your RBI work environment away from the Sisyphus labor of traditional RBI methods.
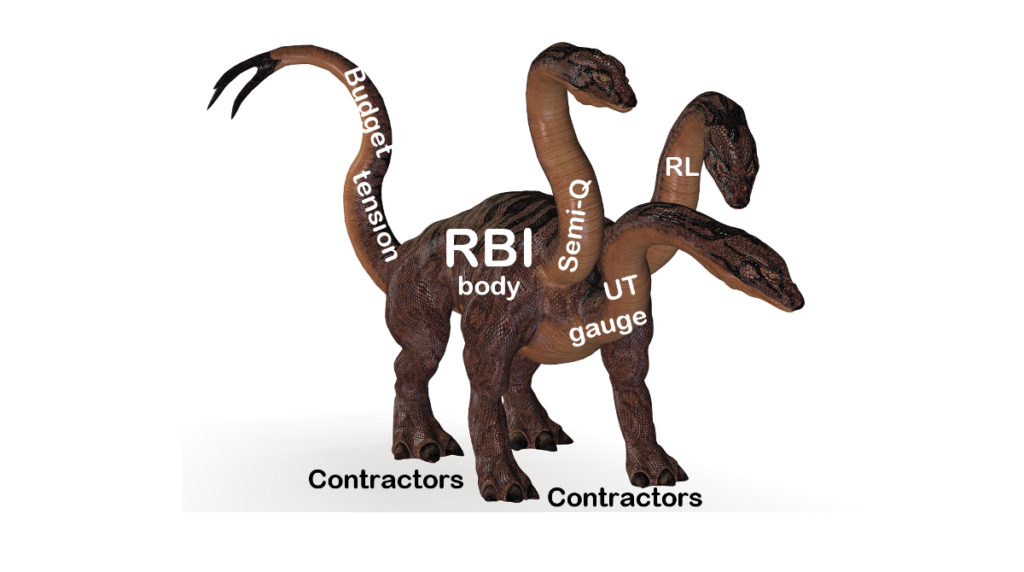
Asset integrity use the term ‘RBI loop‘, rather of a double meaning though. It formally stands for a continuous risk management process. But sometimes we feel it like a ‘loop work‘ indeed:

You may reply: you are too busy.
But isn’t that because of doing a ‘loop work’?
Do you want to break the chain of ever repeating integrity challenges?
Do you need a common and solid roof over the asset integrity market options?
Why then not acting right now?
We’ve put a huge effort in constructing the CoRBI®. It evolved gradually from the real issues we seen. And you don’t need to repeat this process at own expense. Give it a try – you’ll wonder how practical it is, by comparison. By the way, corrosion damage is far not all we address in our methods. Cracking is welcome. Design support is welcome. We call this concept WholePro®.
You can find our conference videos explaining these methods at our main web page here and maybe drop us few lines using this contact form. We can serve you globally as we have everything to operate 100% remotely.